Everyone likes pictures. Generate a report without any pictures, graphs, or charts and see how many ‘likes’ you get at work.
Everyone gets excited about data modeling, and in some circles, folks think that data models are synonymous with diagrams. But really, the diagram is just the ‘pretty picture’ you add to your office report. Don’t get me wrong, these pictures CAN be very important.
There are lots of things you can do to customize the look and feel of your diagrams. You can change colors and fonts, add pictures (also new for 4.1), create subviews (which filter the objects shown), and displays (which allow you to have different visual versions of your diagrams.)
I had originally said this was new in version 4.1, umm no. Apparently it’s been in here since version 2.1 and I just haven’t been paying attention. So if you haven’t seen it before, it’s probably new to you Image may be NSFW.
Clik here to view.

Clik here to view.
Yet another way to share information via pictures.
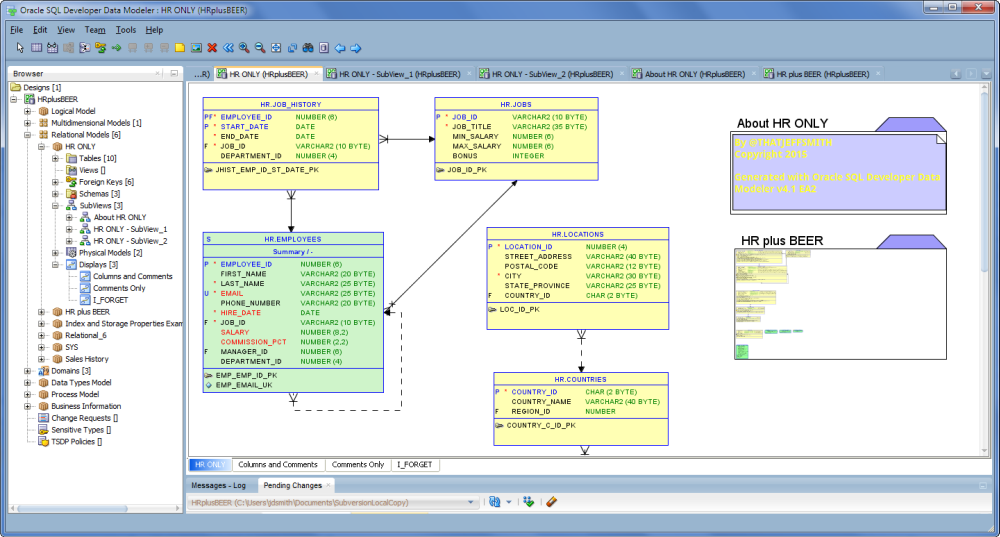
You can drag and drop a display, model, or subview to an existing diagram.
Those new visual artifacts now also act as hyperlinks. So I can quickly ‘jump to’ say a version of my diagram that only has comments. Or I can even link to a different model in my design.
Clik here to view.
Select the item from the tree and drag it to the diagram
Double-clicking on the diagram object immediately opens said display, subview, or model.
